ABOUT EVENT
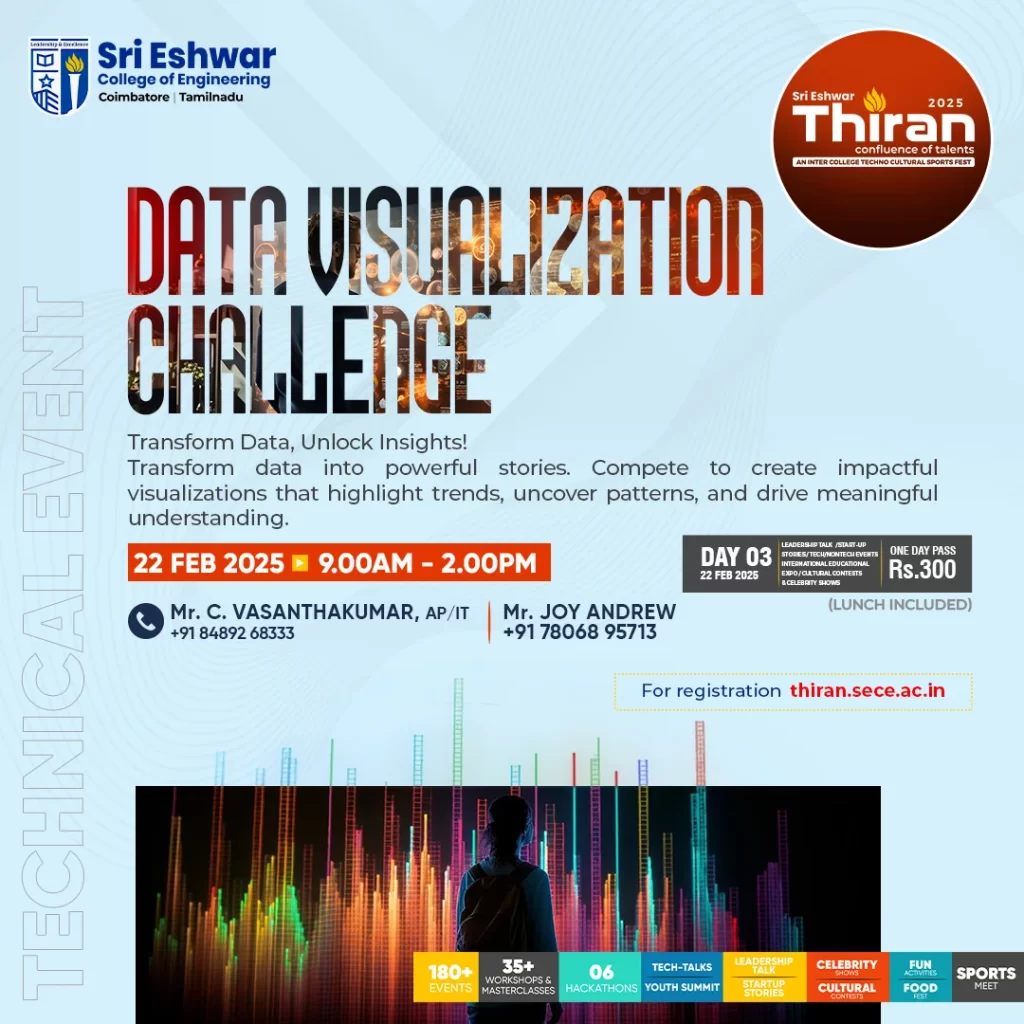
Data Visualization challenge
“Transform Data, Unlock Insights!”
Transform data intopowerful stories . Compete to create impactful visualizations that highlight trends, uncover patterns, and drive meaningful understanding.
EVENT RULES
EVENT DESCRIPTION
The Data Visualization Challenge aims to showcase creativity, analytical skills, and the ability to translate complex data into clear and engaging visual representations. Participants will work with provided datasets and external data to create visualizations that communicate key insights.
GUIDELINES
- Eligibility:
- Two or three participants per team, all from the same college or university.
- The team’s name should be unique and must not include the institute’s name in any form.
- Participants must bring their own laptops.
- Data: Provided dataset & external data (must be publicly accessible and properly cited).
- Tools: Participants are free to use any data visualization tools they prefer (e.g., Tableau, Power BI, Excel, R, Python).
DETAILS
- Understand the Dataset
- Spend time exploring the dataset, identifying key variables, and understanding the context.
- Choose the Right Visualization
- Use bar charts, line graphs, scatter plots, maps, or dashboards depending on the type of data and insights you wish to highlight.
- Make It Accessible
- Include labels, legends, and annotations to ensure your visualization is easy to interpret. Avoid clutter or unnecessary decorations.
- Focus on Insights
- Highlight trends, anomalies, or patterns that provide value to the audience.
- Ethics and Transparency
- Ensure the data is presented honestly, without manipulation to mislead.
EVALUATION CRITERIA
- Clarity and Effectiveness: How effectively the visualization communicates the key insights and findings from the data.
- Visual Appeal: The aesthetic quality and overall design of the visualization.
- Creativity and Innovation: The originality and uniqueness of the visualization approach.
- Technical Accuracy: The accuracy and completeness of the data representation.
- Storytelling: The ability of the visualization to tell a compelling story with the data.

